
Journal Club for March 2024:
Unveiling Spatiotemporal Deformation and Dynamics of Soft Materials at Extremely High Rates through Laser-Induced Inertial Cavitation
Jin Yang*
Department of Aerospace Engineering and Engineering Mechanics,
The University of Texas at Austin
*Corresponding author. Email address: jin.yang [at] austin.utexas.edu
1. Introduction
Cavitation is a fascinating phenomenon which manifests across a broad spectrum of biological and engineering systems, from the prey-stunning capacity of the snapping shrimp to cavitation erosion on metallic pumps and propellers, to cavitation induced cell and tissue damage [1-6]. When harnessed carefully, focused, energy-driven cavitation can be a very beneficial tool in a wide array of surgical, medical, and materials applications including: tissue phantom, laser surgery, lithotripsy, DNA injection and more recently, high to ultra-high strain-rates soft material characterization [7-15].
Inertial cavitation can be dynamically triggered by different external stimuli including ultrasound, laser, shock waves, hydrodynamic variations, electrical discharges, and microwave radiation. Particularly, laser-induced inertial cavitation (LIC) focuses a high-energy laser into a small region of liquid or soft solid materials, causing the liquid to vaporize and form a bubble rapidly. As this bubble expands and then collapses, it generates powerful shock waves and high temperatures, leading to a variety of effects and applications. This phenomenon harnesses the intricate interplay between light, heat, and mechanical forces, where laser parameters can be further precisely controlled to tailor the cavitation process for specific outcomes, making laser-induced inertial cavitation a versatile and powerful tool in both scientific research and industrial applications.
In this blog, we delve into three cutting-edge research advancements leveraging LIC. Our journey begins with the innovative use of soft hydrogels, mimicking various human tissues, to study the effects of high-rate mechanical loads, such as those experienced in vehicular accidents or military encounters. We introduce a novel experimental technique, Inertial Microcavitation Rheometry (IMR), enabling the extraction of materials' viscoelastic properties at extremely high strain rates (> 10^3 1/s), shedding light on their behavior under extreme conditions [15,22,32,33].
Next, we explore the dynamic surface instabilities, like wrinkles and creases, that manifest on the bubble walls during LIC experiments. These instabilities can significantly degrade the surrounding material performance and cause material damage, which can be especially harmful when occurring in soft biological tissues and generating unwanted collateral damage. A newly developed theoretical framework offers insights into predicting and potentially mitigating these instabilities, guiding cavitation applications toward safer, more effective outcomes [34].
Lastly, we will introduce a new experimental method to resolve the full-field, spatial variance, and evolution of heterogeneous deformation signatures in the surrounding material during LIC. Previous experimental methods focused on providing such full-field information have included background-oriented Schlieren [16-19], interferometry [20,21], particle tracking (PT) [22,23], and particle image velocimetry (PIV) [24-28] methods. While these techniques have provided some information about the deformation fields near a cavitating bubble, they have primarily focused on investigations in liquids and have remained mainly qualitative or approximate with generally low spatial information. Our method combines and further improves recent advances in adaptive mesh digital image correlation and subsurface speckling methods, namely the SpatioTemporally Adaptive Quadtree mesh Digital Image Correlation (STAQ-DIC) method [29] and the subsurface Embedded Speckle Plane (ESP) patterning method [30,31]. We present the first direct, high-resolution, full-field, high-strain-rate, and large-deformation measurements of highly compliant viscoelastic hydrogel materials during LIC [32].
2. Materials and Methods
2.1 Laser-induced Inertial Cavitation Experiments
The laser-induced inertial cavitation platform has been described in detail in our previous works [15,22]. The methods to synthesize different biomimetic hydrogel samples, polyacrylamide (PAAm) [22], gelatin [32], and agarose [33] are reported in our previous work. Their material properties are characterized using large amplitude oscillator shear rheometer whose quasistatic material shear modulus G∞ are summarized in Table 1. Briefly, a single inertial cavitation event was generated within each sample's plane through spatially focused laser energy deposition within the focal plane of the soft material sample. A tunable (1-25 mJ) Q-switched Nd:YAG laser with a pulse width of ∼4 ns was frequency-doubled to 532 nm, expanded, and steered into the rear aperture of a Nikon Plan Fluor 20×/0.5 NA imaging objective through the backport of a Nikon Ti2-E microscope (Nikon Instruments, Long Island, NY). Each cavitation event’s expansion, collapse, and subsequent rebounds were recorded at 1-2 million frames per second using a ultra- high-speed camera (Kirana5M, Specialized Imaging). Pulsed illumination of each frame was achieved through a coupled SILUX640 laser illumination system with a pulse duration of 20 ns. Cavitation events were generated 600 µm above the bottom surface and separated from edges and other bubbles by a minimum of 1 mm to ensure boundary effects remained negligible. The LIC experimental setup is summarized in Fig. 1(b).
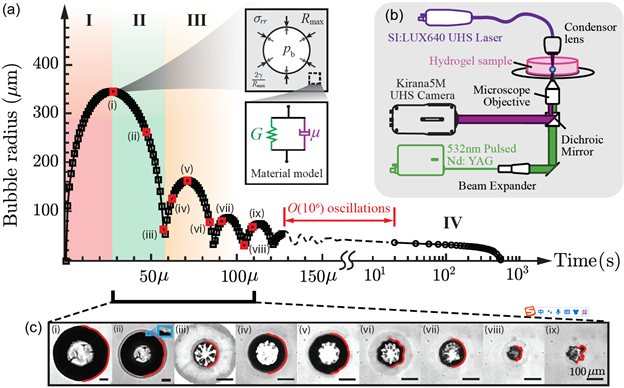
A representative bubble radius vs. time curve for a laser-induced cavitation bubble inside an 8% polyacrylamide (PA) hydrogel is fitted and shown in Fig. 1(a). Regimes I, II, and III represent the bubble’s first expansion, first violent collapse, and subsequent expansion-collapse cycles. Regime IV in Fig. 1(a) measures how bubble slowly dissolved after longer time ∼O(100)s, where bubble radius continuously decreased due to a slow diffusion process of the internal gas content and bubble radius is measured every 20 seconds. Compared to Regime IV, Regimes I-III are inertially controlled behavior where the diffusion process across the bubble wall can be neglected due to its slow characteristic time. Here we mainly focus on Regime II and assume this regime are dominated by the mechanical interaction between bubble inside gas dynamics and the surrounding viscoelastic material behavior.
Figure 1. Laser-induced inertial cavitation experiments. (a) A representative bubble radius vs. time curve for laser-induced inertial cavitation in an 8% polyacrylamide hydrogel: (I) Initial bubble growth phase. (II-III) Bubble undergoes collapse and expansion oscillations due to the interaction between the internal gases and the surrounding viscoelastic soft matter. (IV) The bubble finally dissolves in a diffusion-driven process. (b) Experimental setup of LIC experiments (adapted from [22]). (c) Various types of non-spherical bubble shapes correspond to different time points (squares) in (a). Red lines are overlaid onto original images to visualize the shape of the bubble wall (adapted from [34]).
2.2 Embedded Speckle Patterns and Digital Image Correlation
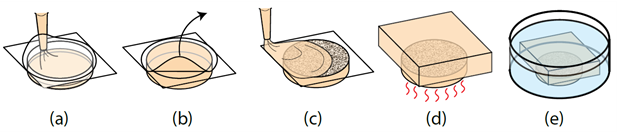
To track the material’s dynamic behavior due to LIC, we employ the Embedded Speckle Pattern (ESP) method as described in Refs [30-32] in detail. Here, we briefly summarize the ESP method to pattern a flat speckle plane within gelatin hydrogels. This method begins with dispensing molten gelatin into a glass-bottom dish shielded by a thin PET membrane (Fig. 2a). After the gel has set, the thin PET film is removed, revealing a flat surface (Fig. 2b). A speckle pattern is added to the surface and then covered with molten gelatin heated slightly above its melting temperature (Fig. 2c). After the gel has been set, the entire sample is heated to the gel transition temperature and allowed to fuse (Fig. 2d). The sample is placed within a cold-water bath to hydrate to equilibrium before LIC experiments (Fig. 2e).
Figure 2. A graphical overview of the fabrication method for embedding a speckle plane within a gelatin hydrogel. (a) Molten gelatin is pipetted into a glass-bottom dish covered by a thin PET membrane. (b) After the gel has set, the thin PET film is removed, revealing a flat surface. (c) A speckle pattern is added to the surface and then covered with molten gelatin heated slightly above its melting temperature. (d) After the gel has been set, the entire sample is heated to the gel transition temperature and allowed to fuse. (e) The sample is placed in a cold-water bath to hydrate to equilibrium (adapted from [32]).
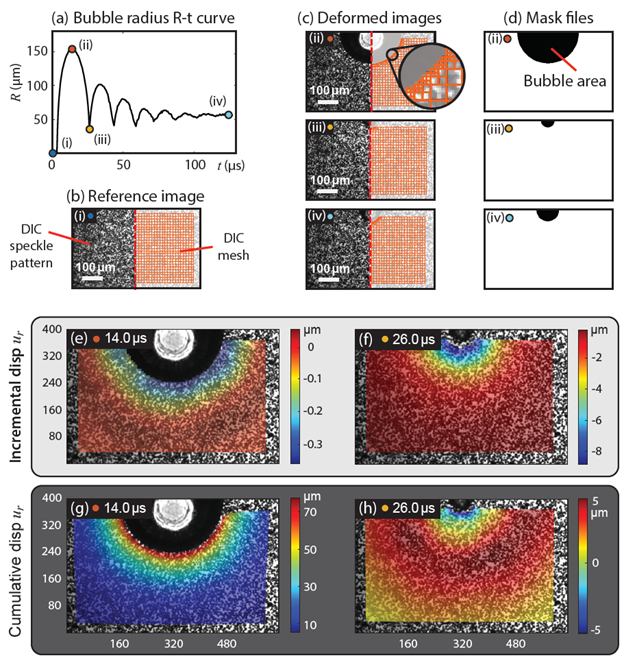
To analyze the material deformations during LIC events, we utilized our recently developed SpatioTemporally Adaptive Quadtree mesh Digital Image Correlation (STAQ-DIC) image tracking algorithm [29] by comparing the sequential image frames during cavitation against the reference frame (e.g., Fig. 3(c:ii-iv) compared to Fig. 3(b:i)) to reconstruct the history of full-field material deformations within a planar slice during each LIC event. In STAQ-DIC, we employ an incremental tracking mode where every two consecutive frames are compared to each other to obtain an incremental displacement field. In order to more accurately resolve the displacement and strain fields near boundaries, STAQ-DIC generates an adaptive quadtree mesh based on a binary image mask built from the actual raw image, which is used to adaptively refine the displacement and strain data near the bubble wall. All the tracked incremental displacement fields are further interpolated at the same set of material points as in the first reference frame and are then added together to obtain the cumulative displacement fields. The resulting cumulative displacements represent the net displacement fields between each of the deformed images during cavitation (e.g., Fig. 3(c:ii-iv)) and the beginning image frame before cavitation (e.g., Fig. 3(b)). For example, the cumulative radial displacement fields at 14.0 μs and 26.0 μs are shown in Fig. 3(g, h).
Figure 3. Digital image correlation post-processing for laser-induced inertial cavitation in gelatin hydrogels [30]. (a) A representative measured laser-induced inertial cavitation bubble radius versus time curve in a 10% gelatin hydrogel. (b) The reference virgin material and DIC mesh are shown in a split view bisecting the bubble nucleation site. (c) Insets (ii-iv): deformed raw images split with generated adaptive quadtree meshes at time points 14.0, 26.0, and 125.0 μs, respectively. (d) Examples of binary masks at 14.0, 26.0, and 125.0 μs corresponding to the data are shown in insets (ii-iv). (e–h) Measured incremental and cumulative radial displacements at 14.0 μs and 26.0 μs.
3. Theory
3.1 Single-bubble dynamics modeling in a soft material
It is convenient to consider the idealized scenario of a single, initially spherical bubble of radius R0 filled with gas and possibly vapor in an infinite, homogeneous medium, subjected to a far-field pressure that may vary with time t. If no external forces (e.g., gravity) perturb the problem symmetry, the subsequent bubble dynamics remain spherical. Assuming homobaric gas behavior and a nearly incompressible near field while accounting for acoustic radiation energy losses, the equations of motion can be reduced to the Keller-Miksis equation [35]:
(1)
where R(t) is the bubble radius, c is the sound speed of the surroundings, ρ∞ is the density of the surroundings, γ is the surface tension, and S is the stress integral. Other models could be used to account for liquid compressibility [35,36]. As discussed in [37], the Keller-Miksis equation is an appropriate description.
To account for large bubble oscillations, and thus large stretch ratios, we model the surrounding material as a Kelvin-Voigt-type viscoelastic soft material where the surrounding material is modeled as a hyperelastic neo-Hookean branch (shear modulus is G) in parallel with a linear (Newtonian) viscous dash-pot (viscosity is μ) (see Fig. 1a) [15]
(2)
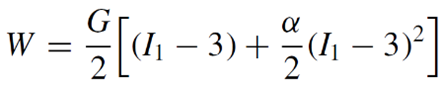
A quadratic-law Kelvin-Voigt (qKV) constitutive model is further derived to consider the strain-stiffening effects of the surrounding material. In the qKV model, we replace the neo-Hookean spring with a higher-order hyperelastic spring whose strain energy density function is defined as [22]:
(3)
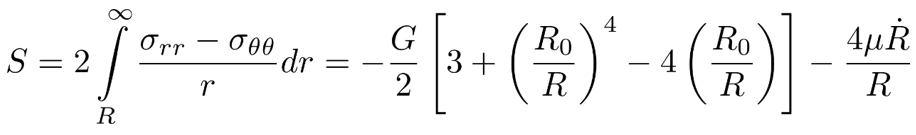
where I1 is the first invariant of the right Cauchy-Green deformation tensor, i.e., I1 = λ1^2 + λ2^2 + λ3^2 and {λi} are principal stretches, G is the ground-state shear modulus, and α is a dimensionless material parameter characterizing large deformation strain-stiffening effects. The stress integral is written as:
(4)
Heat and mass transfer may affect the bubble dynamics [38]. The energy and mass balance equations in the bubble and in the surroundings can be solved and matched at the bubble interface with appropriate boundary conditions on the temperature (concentration) and heat (mass) flux. The bubble pressure is expressed as the sum of gas and vapor partial pressures. The gas pressure can be considered spatially uniform as long as the bubble dynamics are not too fast compared to the gas’ sound speed. The energy balance inside the bubble can then be expressed by assuming Fourier’s Law. The mass diffusion of gas mixture inside bubble can be modeled to follow Fick’s Law.
Different levels of fidelity can be considered. A common simplification is assuming the surroundings remain at a constant temperature (cold liquid assumption), thus effectively acting as an infinite heat sink. Another simplification is to assume that the non-condensible gas behaves in a polytropic fashion.
3.2 Small-amplitude departures from sphericity in a soft solid material
Compared to water, cavitation in a soft viscoelastic solid material can produce distinctively different complex (nonspherical) instability patterns, including bubble surface wrinkles and creases. While wrinkles are smooth undulations that can generate significant surface strains along the bubble-material interface, creases, which are defined by their topologically sharp features and extreme local curvatures, can produce even higher surface strains, which can push a material past its inherent breaking point, leading to significant material damage or fracture [39-41]. An example data set of a laser-nucleated inertial cavitation bubble in a polyacrylamide (PAAm) hydrogel shows how surface instabilities can cause more than a 25% increase in the local radial strain and more than a 30% stress increase along the bubble-gel interface (see Fig. 1c and [34] Supplementary Information Section S4). This type of strain and stress amplification is a hallmark feature of the presence of instabilities in a solid, not typically observed in a fluid. Perhaps most importantly, these kinds of surface instabilities, e.g., wrinkles and creases, can significantly degrade the performance of any soft matter system and can be especially harmful when occurring in soft biological tissues, generating unwanted collateral damage in eye laser surgeries [42] or histotripsy procedures [43-45].
To address this knowledge gap, we present a new, general theoretical framework for predicting the onset and evolution of nonspherical instabilities during inertial cavitation in soft, nonlinear viscoelastic solids [34]. Mathematically, predicting the onset of nonspherical instabilities during inertial cavitation in a soft, nonlinear viscoelastic material is more challenging than in water. The constitutive laws of viscoelastic solids are typically expressed using a Lagrangian description based on the reference configuration, while the cavitation dynamics are typically described in the current, deformed configuration, which must be accounted for when theoretically describing and predicting the onset and evolution of inertial cavitation instability patterns within a soft solid.
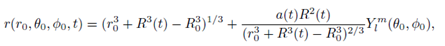
We consider a first-order displacement perturbation, which is added to the base-state spherically symmetric displacement field following:
(5)
where a(t) is the time-dependent perturbation magnitude at the bubble wall and is assumed to be much smaller than R. Perturbation in Eq (31) satisfies the incompressibility condition of a solid material requires “det(F) = 1” instead of “div(v) = 0”, where F is the deformation gradient tensor and v is the velocity vector. Plugging the above perturbation ansatz Eq (5) into the momentum equation and applying boundary conditions, we recover the Rayleigh-Plesset governing equation and the governing second-order differential equation for the bubble-wall perturbation magnitude, a,
(6)
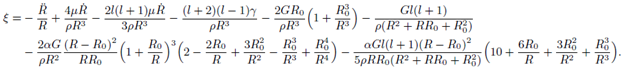
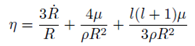
where parameters η and ξ are defined as
(7)
. (8)
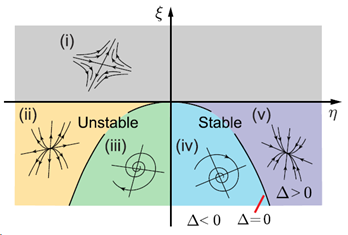
Examining the associated dynamical system (see Fig. 4), we find that perturbations grow if η < 0 or ξ > 0 and decay if η > 0 and ξ < 0. Thus, nonspherical instabilities can be quantitatively predicted via the signs of the above two parameters, η and ξ, which are affected by the bubble dynamics base state {R, R,t, R,tt}, the surrounding material’s constitutive properties, namely, the material’s viscosity μ, shear modulus G, and strain-stiffening parameter α, as well as the surface tension γ. We will assess the goodness of this theoretical model in Section 4.2.
Figure 4. Phase diagram summarizing the stability of the solution a∗ := {a = 0, a,t = 0} for an inertial cavitation bubble in a nonlinear viscoelastic medium (∆ = η^2 + 4ξ).
4. Results and Discussion
4.1 High-rate Material Characterization
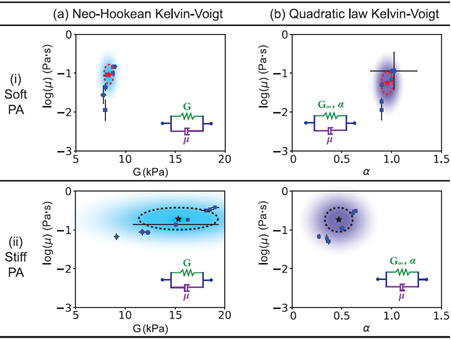
By fitting the bubble radius vs. time curve beginning from the first peak to close to the first collapse, we obtain the viscoelastic properties of hydrogels using both neo-Hookean Kelvin–Voigt (NHKV) and quadratic law Kelvin–Voigt (qKV) models, where all of the fitted parameters are summarized in Figs. 5-6 and Table 1. The fitted, dynamic shear moduli predicted from the neo-Hookean Kelvin–Voigt model are one order of magnitude stiffer than their quasi-static counterparts. Furthermore, the large standard deviation of the possible dynamic shear modulus values for the case of the stiff PA gel might lend additional credence to choosing a strain stiffening constitutive model. Thus, using the quadratic law Kelvin–Voigt model, this issue is remedied by keeping the equilibrium shear modulus fixed, and introducing the parameter α (see Eq. (3)) to account for strain stiffening effects (Fig. 5) explicitly.
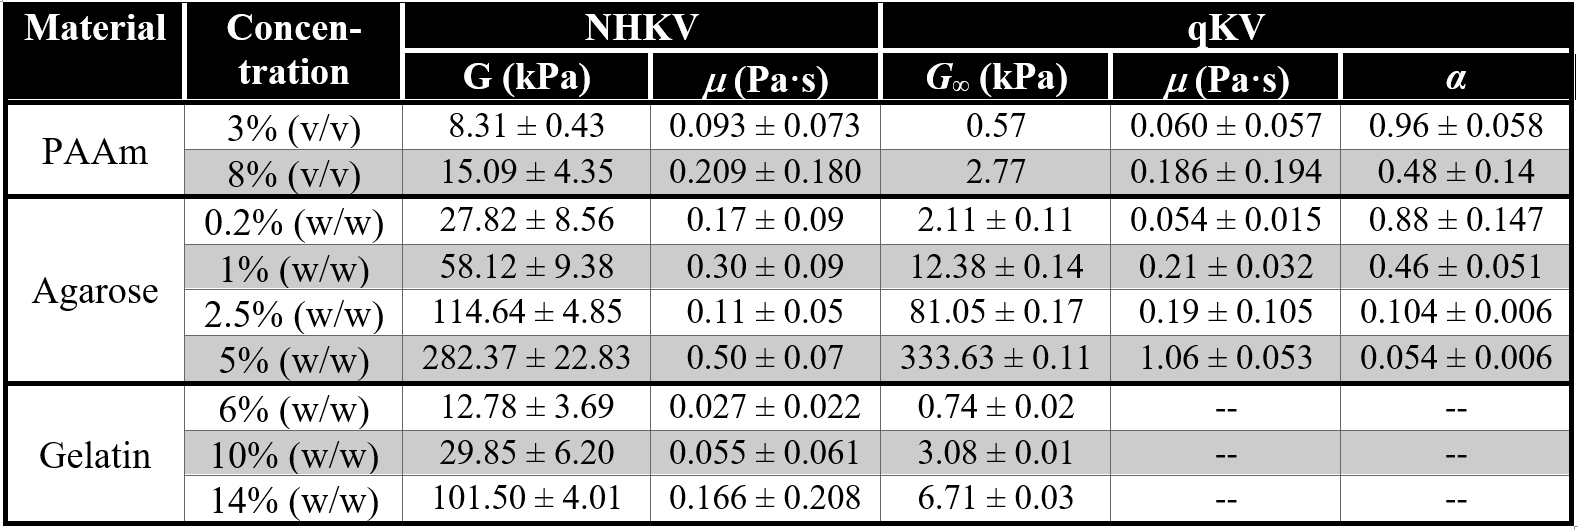
Table 1. Summary of IMR-fitted viscoelastic material properties for various soft materials over a strain rate envelope of 10^3 1/s ∼ 10^6 1/s [65].
Figure 5. Fitted material viscoelastic properties of both (i) soft and (ii) stiff polyacrylamide hydrogels using (a) neo-Hookean Kelvin–Voigt and (b) quadratic law Kelvin–Voigt models. Dashed circles and shaded areas represent one- and two-times standard deviations, respectively.
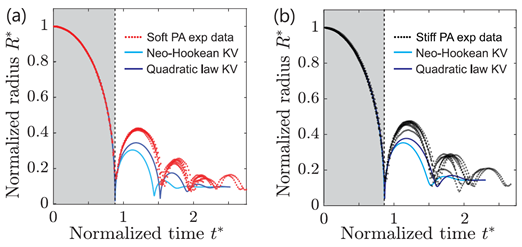
Figure 6. Normalized bubble radius versus time curves with NHKV and qKV single peak material model fits overlaid for (a) soft polyacrylamide and (b) stiff polyacrylamide hydrogels.
4.2 Predicting complex nonspherical instability shapes of LIC bubbles
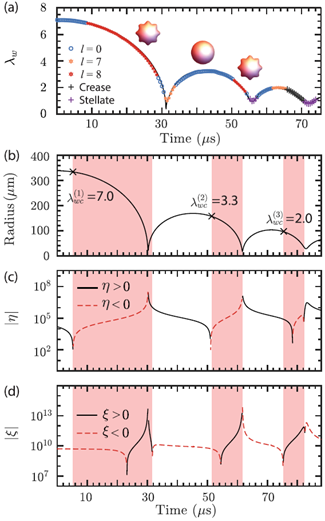
Utilizing the radius vs time data from the experimental observations in Fig. 1(a) and Eqs. (6-8), we can theoretically predict the onset of various nonspherical instability patterns during the LIC process, which we describe by the circumferential stretch ratio (i.e., ratio of deformed and undeformed bubble radii) at the bubble wall, λw := R/R0. For illustration, based on the data shown in Fig. 1a, we consider the emergence of instability mode shape l = 8. The evolution of the bubble radius R in this case is numerically simulated, and the histories of the bubble radius and the quantities η and ξ are plotted in Figs. 7(b-d). Conditions under which nonspherical instabilities corresponding to l = 8 are predicted (i.e., η < 0 or ξ > 0) are shown as red-shaded regions in Figs. 7(b-d). The onset of nonspherical deformation predicted by our theoretical instability model is in good agreement with the experimental observations in Fig. 7(a) during each of the first three collapse cycles. We find that most shape instabilities in a laser-induced cavitation event usually occur during the collapse phases, which are dominated by inertial effects when the bubble wall has a large negative radial velocity and acceleration, causing η and ξ to take on negative and positive signs, respectively, as shown in Fig. 7. This is consistent with our experimental observations shown in Fig. 1(a).
Figure 7. (a) Circumferential stretch ratio at the bubble wall (λw := R/R0) for the experiment in Fig. 1(a). Histories of (b) the bubble radius R and the quantities (c) η and (d) ξ are numerically computed using simulation parameters based on Fig. 1(a). Red-shaded regions denote situations in which nonspherical instabilities corresponding to l = 8 are predicted. The critical values of λw at the onset of instability occurring during the first three collapse cycles are shown as black x’s in (b) [34].
4.3 High‑speed, full‑field deformation measurements near LIC bubbles Inside viscoelastic hydrogels
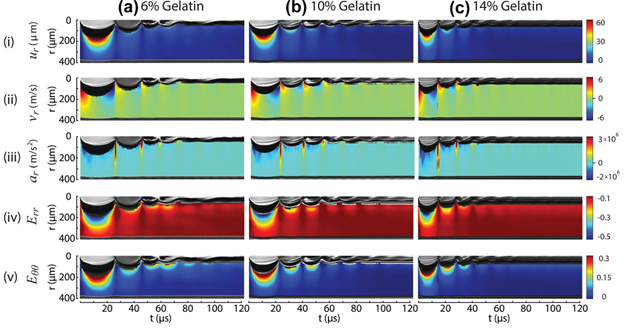
Using the DIC post-processing routine as described in “2.2 Embedded Speckle Patterns and Digital Image Correlation”, we obtain displacement fields for all 250 frames of the LIC event. All events were recorded with a camera frame rate of two million frames per second. Because our LIC events are almost spherically symmetric, DIC-tracked 2D-projected deformation fields on the r-θ plane. We extract a 10-pixel wide vertical slice of each frame’s full-field results (i.e., θ ∼ −π/2) and concatenate them together to create kymographs to visualize the spatiotemporal evolution of the kinematic fields for each gelatin concentration due to the laser-induced cavitation event as shown in Fig. 8. Results for 6%, 10%, and 14% gelatin hydrogels are summarized in Fig. 8(a), (b), and (c) columns, respectively. The evolution of the radial displacement ur, radial velocity vr, radial acceleration ar, radial logarithmic strain Err, and circumferential logarithmic strain Eθθ fields for similarly sized bubbles are shown in Fig. 8 rows (i-v). One point to note is that the visualized kymographs are created directly from DIC post-processing results without additional smoothing or averaging operations.
Figure 8. Kymographs of kinematic fields in three concentrations, (a) 6%, (b) 10%, and (c) 14%, of gelatin due to a single laser-induced cavitation bubble. The kymographs are created by taking a 10-pixel-wide vertical slice of the full-field data symmetric about the center of the cavitation bubble for each frame over 250 frames at a camera frame rate of 2 million frames/sec. The resulting (i) radial displacement ur, (ii) radial velocity vr, (iii) radial acceleration ar, (iv) radial logarithmic strain Err, and (v) circumferential logarithmic strain Eθθ fields are plotted against time for all three gelatin concentrations. The cavitation bubble is shown as the black and grey region at the top of each series in all of these kymographs.
5. Conclusions
| Attachment | Size |
|---|---|
| Fig1.png | 183.07 KB |
| Fig2.png | 54.48 KB |
| Fig3.png | 535.57 KB |
| Fig4.png | 35.2 KB |
| Fig5.png | 68.92 KB |
| Fig6.png | 58.26 KB |
| Fig7.png | 72.62 KB |
| Eq1.PNG | 20.36 KB |
| Eq2.PNG | 19.27 KB |
| Eq8.png | 30.66 KB |
| Eq8.png | 216.76 KB |
| Fig8.png | 275.98 KB |
| Tab1.PNG | 93.01 KB |
| Eq3.png | 11.21 KB |
| Eq4.png | 21.66 KB |
| Eq5.png | 11.01 KB |
| Eq6.png | 2.3 KB |
| Eq7.png | 5.57 KB |