
Hi all,
I am working on Abaqus 6.8. I am doing a pile loading
analysis in dense sand. I am not understanding how to plot
load-displacement plot by using static general step. I mean where i
should assign reaction forces and displacement in output request. i have
assigned a set at middle of pile and requested for disp. in output
request also i have made a set of bottom which is fixed and ask for
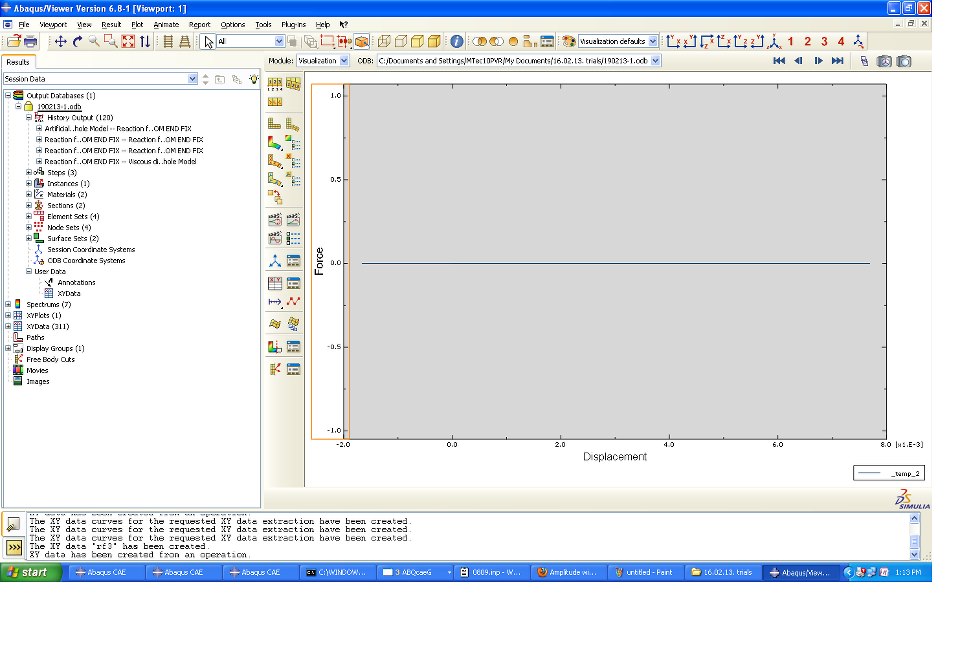
reation force in output request. i summed up all reaction forces and
combine with displacement. but i am getting zero force and graph becomes
parallel to x-axis having zero force on y-axis and displacement
increases. plz advice me what to do. Thanx in advance to look into this
problem.
| Attachment | Size |
|---|---|
| load-disp. curve.jpg | 88.59 KB |
Are you shure that the
Are you shure that the x-axis is displacement. Maybe you should print both, displacement and RF versus time. And then export the plot to Excel and make there the RF vs. displacement.
How did you applied the displacement? I use a constrain (all nodes of a side are constrained to a singel reference node) and the displacement is forced on the reference node.
maybe you could upload the input file.
With kind regards
Christoph
Same problem
Hello all,
I working in crack growth in rock model. I applied 1mm displacement at top and bottom for 2D rectangular model and restricted BC on 4corners in x-direction. In the results i can able to get crack growth, but when i used to plot Force Vs Displacement in front of crack tip in model im getting zero force with increase in displacement over time...
regards,
Siva